The political climate of a city reflects the political beliefs of the people living there, which many people find important to know. Many cities reflect the political stances of the state they are located in. Do the residents of Olympia, Washington have a largely liberal or conservative mindset?
Olympia, Washington is a moderately liberal city. Thurston County, where Olympia is located, is also moderately liberal; 57.5% of residents have voted for the Democratic Party in the 2020 presidential election. The state of Washington itself is moderately liberal and has voted for the Democratic presidential candidate since 1988.
The political climate of a city has many factors. By studying an area’s results of presidential elections, political history, local leaders, demographics, and more, these factors can be better understood. This article will study what makes Olympia, WA blue-leaning.
Political History of the State
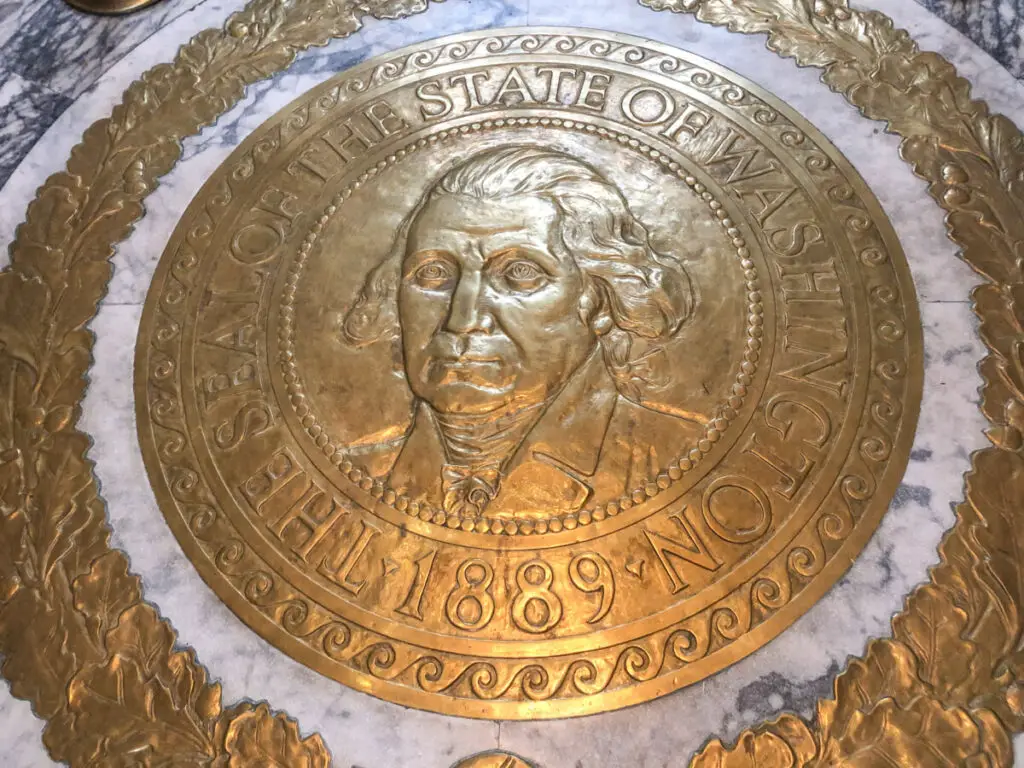
Washington state has a history of liberal support and progressive politics, but racism and xenophobia are still prevalent. It became a state in 1889 after gaining independence from the Oregon Territory. The state was named after George Washington, the first president of the United States.
The state has voted Democratic in all the presidential elections since 1988. Before that, it voted mostly Republican since 1952, only voting Democratic twice out of the nine elections. The state voted Democratic from 1932 to 1948. From the state’s beginning in 1892 until 1928, there were 10 elections. Washington voted for the Republican candidate 7 times, the Democratic candidate twice, and the Progressive candidate in 1912.
Presidential Elections
The state of Washington is moderately liberal , including Olympia. The electoral college vote for Washington has been for the Democratic candidate since 1988.
The percentage of Democratic votes has been between 50% and 60% between the years 2000 and 2020, with the highest being 58.0% in the 2020 election, and the lowest being 50.2% in the 2000 election. The percentage of votes for the Democratic candidate has been between 35% and 45% during that same time period. The highest was 45.6% in 2004, and the lowest was 36.8% in 2016.
Of the 39 counties in Washington, 13 voted for the Democratic candidate in the 2020 election, while 26 voted for the Republican candidate. Despite the fact that half the counties voted Democratic as those that voted Republican, the Democratic candidate won in Washington. There was a much higher number of votes in the Democratic counties.
Thurston County, the county that Olympia is part of, is also moderately liberal . From 2000 to 2020, the percentage of people recorded to have been voting Democratic has been between 50% and 60%. The lowest percentage was 51.27% in 2016 and the highest percentage was 59.57% in 2008. The percentage of Republican voters was between 35% and 45%, with the lowest percentage at 36.23% in 2016 and the highest percentage at 42.55% in 2004. In the 2020 election, 57.5% of residents voted for the Democratic candidate, while 38.8% voted for the Republican candidate, and 38.8% voted Independent.
The city of Olympia, WA is somewhat liberal . The city has voted for the Democratic candidate in all six elections between 2000 and 2020. The difference between the percentage of Democratic and Republican voters was greater than 10% in all six of those elections.
Between 2018 and 2021; 27,298 people contributed money to the Democratic party. These contributions totaled approximately $2,014,690. In contrast, during that same time frame, there were 2,599 contributions to the Republican party. Those contributions added up to $541,132- a substantially smaller amount.
Based on the presidential elections; residents of Olympia, WA certainly lean liberal in their support of candidates and the political parties. However, there is more to the political climate of a city than the presidential election results.
Local Leaders

The local leaders of a city can be representative of the liberal or conservative ideals of the city. The political parties of the elected officials, the action plans they support, and the policies they implement are all reflections in some way or another of the people’s vote.
The Mayor
The mayor of Olympia, WA is Cheryl Selby . She first served on the city council in 2013. She was elected as mayor in 2015, served a four-year term, and was then reelected in 2019.
Her campaign platform was based on statewide income tax, economic development of the city, parks funding, and solving homelessness- though some have said that she hasn’t done enough on that last one.
During Selby’s time as mayor, she passed the 2017 Public Safety Levy ballot measure, which put funding toward training police officers in best practice policies. She also passed the 2018 Home Fund ballot measure, which bunded the building of 200 units of supportive housing with high shelter capacity.
Her past committees and assignments have been the Community Livability and Public Safety Committee, the Capitol Lake Future Process, and the LEOFF 1 Disability Board.
Currently, Selby is developing a cultural access program to allow households with fewer resources to access programs for arts, history, and culture. Its purpose would be to give low-income families more access to and boost the organizations for arts and culture.
Mayor Selby is nonpartisan , so she does not identify as Democratic or Republican. However; most of the ballot measures, committees, and policies she has demonstrated have been similar to liberal ideals. She was also endorsed by
 Planned Parenthood Alliance Advocates and Thurston County Democratic Women, both of which are liberal organizations.
City Council
There are seven city council seats, though technically the mayor fills one of them. The remaining six city council positions are filled by three women and three men. All of the city councilors are considered nonpartisan
 . Some of the assignments and committees that the city council has supported are the Thurston Climate Mitigation, the Joint Animal Services, and the Land Use and Environment Committee.
Policies
Generally speaking, conservatives can be classified as traditionalists; and libertarians can be classified as progressional. Libertarians advocate for the government to take action to establish equal rights. Conservatives advocate for limited government and empowering individuals to make their own pursuits happen.
The policies in an area can often show the political leanings of the area. There are a few policies that tend to be supported by liberals or conservatives that can give us an idea of which way a city or state leans.
Abortion
As of 2017, there were 51 facilities that provide abortions in Washington state. This was a 21% increase from 2014. 59% of counties in Washington do not have clinics that provide abortions, cutting off access to 10% of women in Washington.
Conservative values are often associated with historical and protestant-Christian teachings. Red-leaning voters are often “Pro-Life” and anti-abortion, while blue-leaning citizens are more likely to be “Pro-Choice”. The influx in places that provided abortion services would indicate a more democratic stance within the state of Washington.
Gun Laws
Washington gun laws include universal background checks and extreme risk protection laws. The state had the 12th lowest gun death rate in 2020. The state has waiting periods, background checks, child access prevention laws, and ghost gun (unregulated firearms) laws. Washington does not have effective gun owner licensing laws, concealed or open carry restrictions, safe storage laws, reporting for lost and stolen guns, safety standards, bulk firearm purchase restrictions, or a large capacity magazine ban.
Opposingly, Republican states like Texas allow residents to openly carry guns without permits.
Gay Marriage
Same-sex marriage became legal in Washington in 2012. It was the seventh state to do so, and this was three years before legalizing gay marriage was required by the US Supreme Court.
Far right-winged beliefs are extremely against the practice of same-sex marriage and many public figures belonging to the conservative party have vocalized LGBTQ+ lifestyles and behaviors as sinful.

Demographics
The population of Olympia, WA is 53,620 people. The population density is 2,940 people per square mile. 52.3% of the population is female and 47.7% is male. The median age is 37.3, and the average number of people per household is 2.3.
The racial makeup of Olympia is as follows:
- White: 78.5%
- Black: 2.6%
- Hispanic/Latino: 7.4%
- Asian: 6.8%
- Native American: 0.8%
- Hawaiian/Pacific Islander: 0.2%
- Two or More Races: 3.6%
- Other: 0.2%
44.3% of residents in Olympia are married, and 15.4% are divorced. 29.9% are married with children, and 20.2% are single with children.
The average income in Olympia is $30,206 per year. The average household income is $52,834 per year. The unemployment rate is 5.6%.
93.3% of the population has graduated from high school. 44.1% of residents have a four-year degree.
29.9% of residents in Olympia are religious . 7.7% are Catholic, 1.6% are Baptist, and 4.5 are Church of Jesus Christ. 0.3% follow Judaism, 1.0% follow an eastern faith, and 0.3% affiliate with Islam.
Studies have shown that those with bachelor’s degrees or higher are more likely to be in favor of democratic viewpoints. Women are also more likely to vote blue, and additionally, have higher voter turnouts than men. With both of these statistics being relatively high in the city, the blue-leaning results make sense.
Should a caucasian person be Republican, they are likely to belong to the Christian faith. As those who are religious are in minority within Olympia, it stands to reason that the democratic vote is becoming higher.
Related Topics:
If you like the article above, here are some other similar articles you should check out!
9 Famous Celebrities Who Live in Olympia, Washington
